1. Introduction
In January 2013, the University of Toronto Libraries participated in the LibQUAL+ survey, as part of a consortium of 47 Canadian libraries, of which 25 are members of the Canadian Association of Research Libraries (CARL). The purpose of this report is to summarize and highlight the results of the survey for the St. George Campus libraries. The libraries at the UTM and UTSC campuses have prepared separate reports of their surveys. Included in this report is a brief description of the survey, an account of how the survey was administered, a break-down of respondent demographics, an overall analysis and interpretation of the quantitative survey data, and a follow-up action plan.
2. Background
LibQUAL+ is a survey developed by the Association of Research Libraries that measures user perceptions and expectations of library service quality in three dimensions:
- Affect of Service (AS) – customer services provided by Library staff
- Information Control (IC) – library resources, collections, and access to resources
- Library as Place (LP) – library spaces, facilities and amenities (for study, meeting, etc.)
Survey respondents were asked for their judgements on three scales for each survey question: the desired level of service they would like to receive, the minimum they are willing to accept, and the actual level of service they perceive to have been provided (there was also an N/A category for questions that were rated as not applicable to respondent). The desired and minimum scores establish the upper and lower boundaries of a “zone of tolerance” within which the perceived scores should float. Respondents answered 22 core questions and 5 “local” questions selected for inclusion in all three U of T campus surveys. The core and consortial questions, as well as questions related to information literacy outcomes and overall service satisfaction, are presented in Appendix A (PDF).
Quantitative data collected from respondents for the core service statements were analyzed according to the three dimensions: how the user is treated in the Library (AS), the extent of information and the ability of users to find, use and manage information on their own (IC), as well as the environment and functionality of the building and its facilities (LP). In addition, calculations for overall ratings of service satisfaction were recorded. Respondents rated their satisfaction in each area on a scale of 1 to 9 (with 9 as the highest).
From the ratings provided by respondents, gaps were calculated to assess the degree to which the Library met the minimum expectations of Library users. A service adequacy gap was calculated by subtracting the minimum from the perceived level of service. A negative service adequacy gap implied a need for improvement in that particular service area. At the other end, a service superiority gap was found by subtracting the desired service rating from the perceived level of service. A positive superiority gap indicated that the Library exceeded expectations for that particular service area.
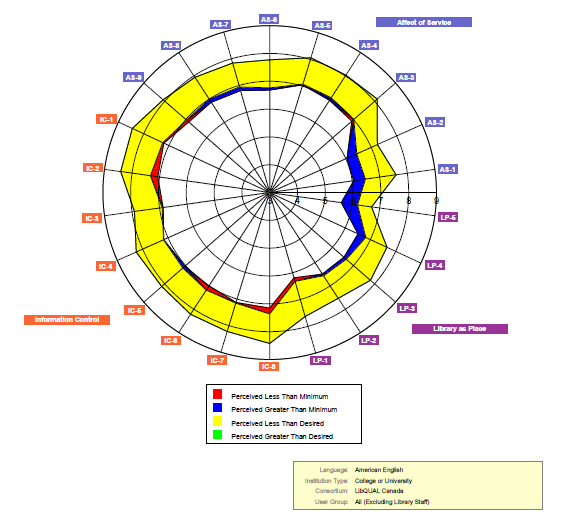
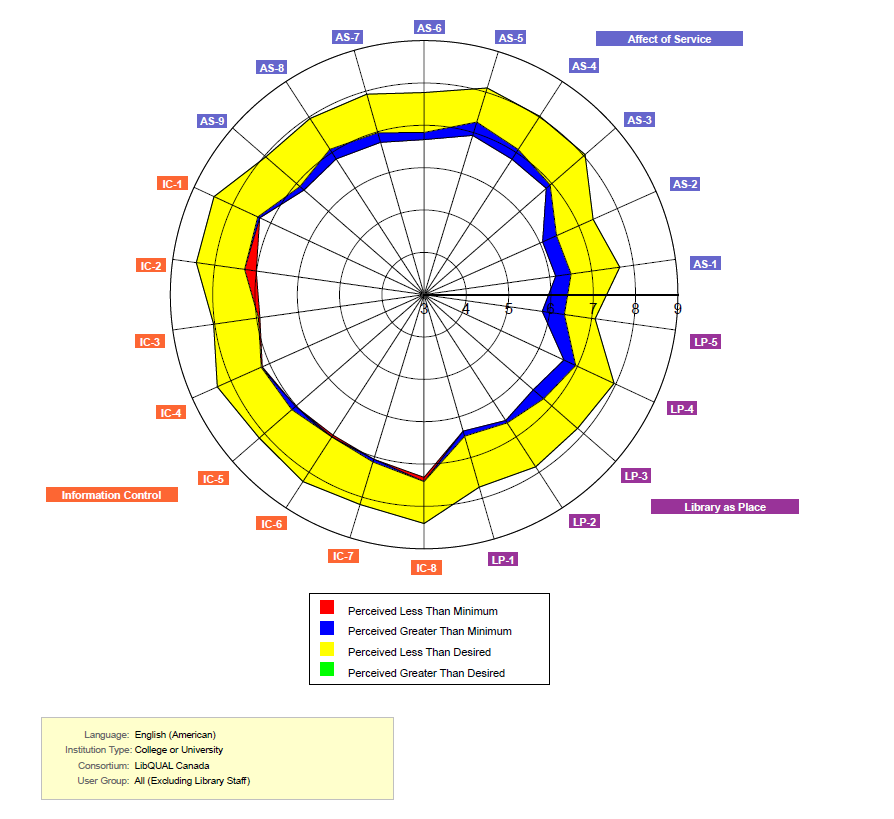
In addition to the gap scores, the range from the minimum service rating to the desired service rating was also calculated, which is called the Zone of Tolerance. Perceived levels of service should fall within this zone. Results are graphically presented using radar charts. Perceived levels of service that fall outside the zone of tolerance are revealed on the radar charts as bright red areas for negative service adequacy or bright green for service superiority gaps.
3. Survey Administration
Survey invitations were sent via e-mail to a random sample of 1200 each of St. George campus undergraduates, graduate students, faculty, and staff members. The invitations were sent on January 17, 2013 and several reminder e-mail notices were sent, weekly, for the following 3 weeks. The response was 516 completed surveys or 11% of the invited participants. By user category, the total number of respondents was represented by 22% undergrads, 36% graduate students, 29% faculty and 12% staff members.
4. Respondent Demographics
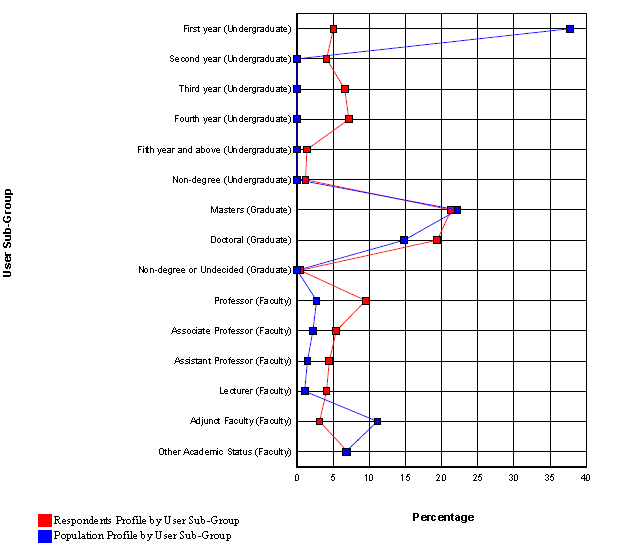
More significant than the overall response rate is the degree to which the respondents represent their respective portion of the population of the St. George campus. Figures 1 and 2 illustrate the correspondence between the university’s published data and the way in which participants self-identified in the survey. Although no data was available about the population sizes of undergraduate year-levels, other than the size of the first-year intake, the undergraduate respondents are fairly evenly divided among the 1st through 4th year cohorts. In the graduate population, the percentage of masters student participants is 100% representative and those identifying as doctoral students are about 5% greater than the university’s population data. The pattern for faculty respondents matches the university’s data for distribution among the ranks.
Figure 1: Respondents by User Sub-Group
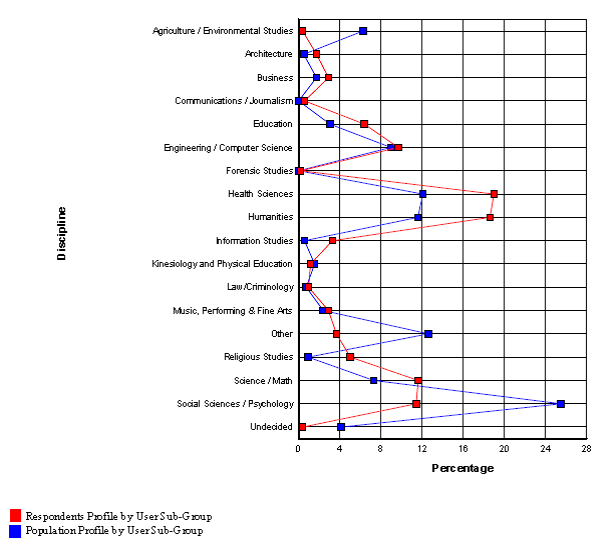
The University’s population, by discipline, is well-matched by the response rate in most narrowly-defined disciplines. Discrepancies do occur in the 6% greater number of respondents from humanities and health sciences communities than the estimated population and the 14% lower proportion of respondents working in the social sciences and/or psychology fields than them published size of the population. See Figure 2.
Figure 2: Respondents by Discipline
5. Survey Results Analysis
The results of the LibQUAL+ 2013 survey have provided the Libraries with some important information about our progress on service priorities identified by library users in our 2007 and 2010 survey findings, as well as new issues of importance to our users.
Figure 3: Overall Results by Survey Year
2007
2010
2013
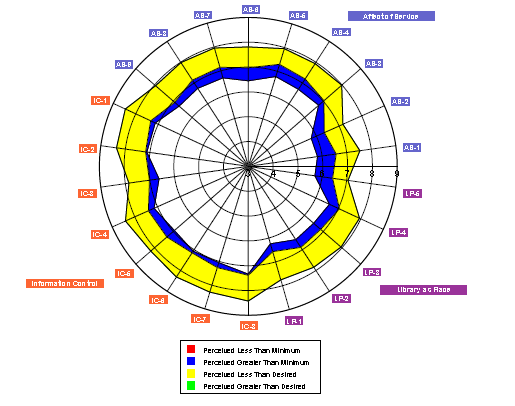
Figure 4: Overall Results, 2013 Survey
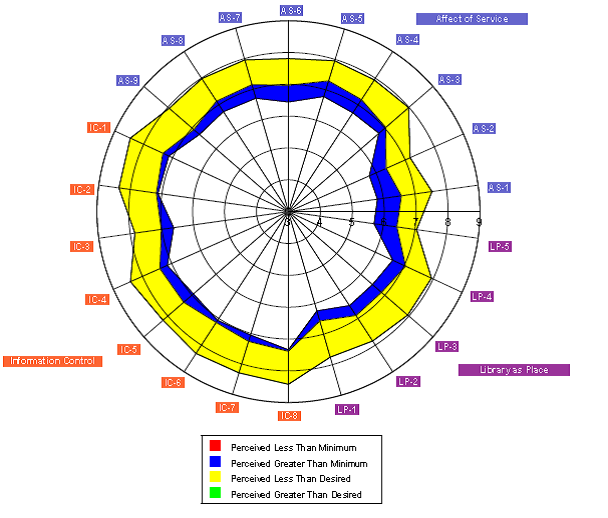
Figure 5: Undergraduates, 2013 Survey
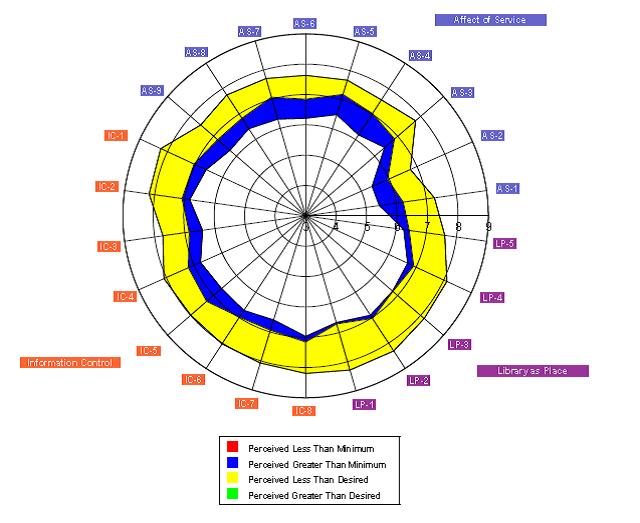
Figure 6: Graduate Students, 2013 Survey
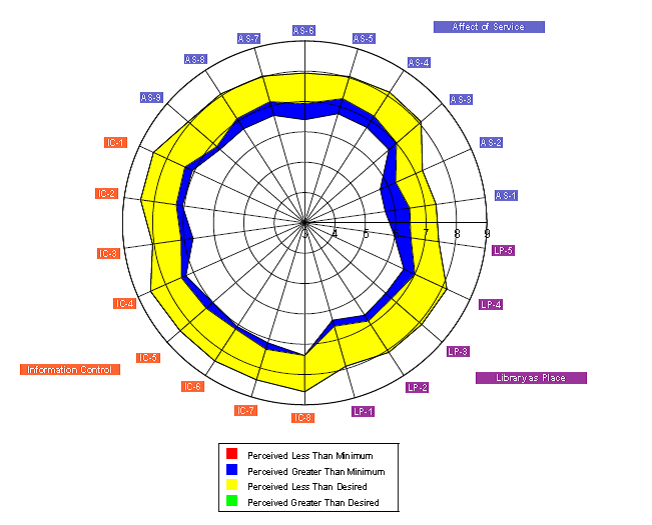
Figure 7: Faculty, 2013 Survey
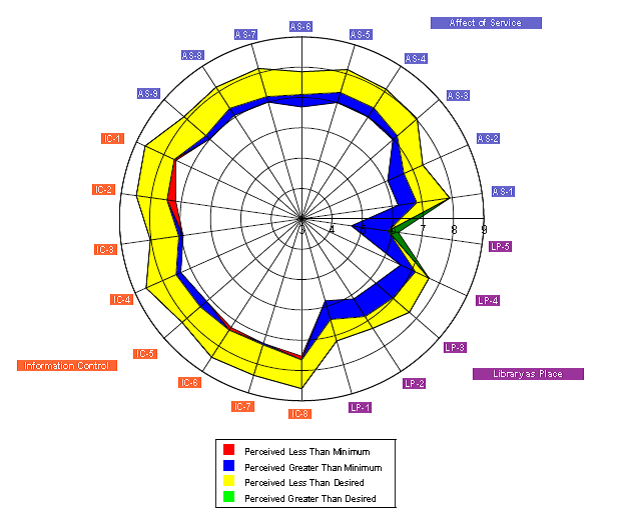
Figure 8: University Staff, 2013 Survey
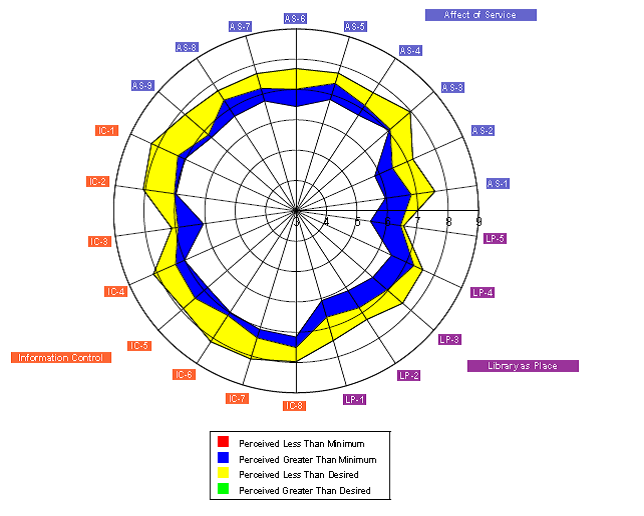
Figure 9: Areas of Concern by Survey Year and User Sub-Group
| Undergraduate Students | Graduate Students | Faculty | All (excluding library staff) |
|---|---|---|---|---|
2007 | AS3 | AS3 |
| AS3 |
|
| AS4 AS5 AS6 AS7 |
| |
AS9 |
| AS9 | AS9 | |
IC1 |
| IC1 | IC1 | |
IC2 | IC2 | IC2 | IC2 | |
|
| IC3 IC4 IC5 |
| |
IC6 | IC6 | IC6 | IC6 | |
| IC8 | IC8 | IC8 | |
| LP1 | LP1 | LP1 | |
|
| LP3 |
| |
2010 |
| AS3 AS4 AS6 AS8 AS9 |
|
|
| IC2 | IC2 | IC2 | |
| IC3 | IC3 | IC3 | |
| IC4 | IC4 | IC4 | |
| IC5 |
|
| |
| IC6 | IC6 | IC6 | |
| IC7 |
|
| |
| IC8 | IC8 | IC8 | |
LP1 | LP1 |
|
| |
| LP2 LP3 LP4 |
|
| |
2013 |
|
| IC1 IC2 IC6 IC8 |
|
The Libraries have made steady progress in addressing concerns raised in the 2007 and 2010 surveys. As shown in Figure 9, above, students’ and faculty members’ satisfaction with library service has increased in all dimensions since the first LibQUAL+ survey was conducted in 2007.
Survey Comments
- Academic Support (PDF)
- Collections (PDF)
- Library Spaces (PDF)
- Online Presence (PDF)
- Public Services (PDF)
Affect of Service
Marked improvement has been made in this dimension of library service since the 2007 survey. In 2007 and 2010, students and faculty identified courteous (AS3), knowledgeable (AS5), caring (AS6) and understanding (AS7) employees, as well as readiness to respond to users’ questions (AS4), willingness to help library users (AS8) and dependability (AS9) as areas of importance and concern.
A comprehensive program of customer service training for all staff was implemented in response to the 2007 survey and continues now as a regular component of orientation for new employees, perhaps contributing to significantly improved scores in this area in the 2013 survey.
Additional initiatives undertaken since the 2010 survey in an effort to improve the library experience and increase engagement with students and faculty include:
- Participation in fall undergraduate and graduate orientation events
- Automation of several library services, including the installation of an automated book return system at Robarts Library and the introduction of an online fines payment system
- Development of an online knowledgebase which library users can query remotely at any time for quick answers to questions about library services and collections
- Expansion of service hours and staffing levels for the popular Ask a Librarian instant messaging reference service
- Outreach and communications librarians were hired at Robarts Library, the Thomas Fisher Rare Book Library and the OISE Library to improve communication with students and faculty regarding available services and to seek feedback from library users on a more ongoing basis.
Information Control
Significant progress has been made in this dimension of library service, which relates to access to library resources and collections either in print or online. The library website, catalogue and other tools that allow users to find information on their own (IC2 & IC6), were identified as priorities and areas of concern for undergraduates, graduate students and faculty in the 2007 survey, and graduate students and faculty in the 2010 survey. As well, remote access to electronic library collections (IC1 &4), access to print collections (IC3), modern equipment (IC5), and journal collections (IC8) were identified as areas of concern in 2007 and 2010. This helped the Libraries develop service priorities for subsequent years and many improvements were made in response, including:
- Enhancements to the library catalogue interface to improve search functionality and results
- Improvements in the quality of catalogue records to ensure better access to the full breadth of our collections
- A virtual shelf browse function was added to the library catalogue to enhance the discoverability of library collections distributed across our extensive 44 library system
- Journal series were made retrievable within 24 hours from our Downsview high-volume storage facility
- Request forms for materials housed in storage at Robarts Library were made available online
Results from the 2013 survey indicate that faculty members remain concerned with library service in this dimension. Efforts will be made to reach out to faculty to find out more about their concerns in this area and identify potential service improvements.
Library as Place
No areas of concern were identified for this dimension in the 2013 survey. However, both expectations and perceived level of service regarding library space have increased. We are pleased to be keeping pace with rising expectations in this area and will continue to consult with library users on an ongoing basis to ensure we understand and address needs and expectations as they evolve.
Initiatives undertaken in response to 2007 and 2010 survey results in this dimension include:
- Major renovations at the Robarts, OISE and Gerstein Libraries to improve and increase student space
- Upgrades to the wireless infrastructure
- Touchscreens and digital building directories were added at Robarts Library to help with building navigation and location of available library workstations